DataViz Blog
DataViz Assignment
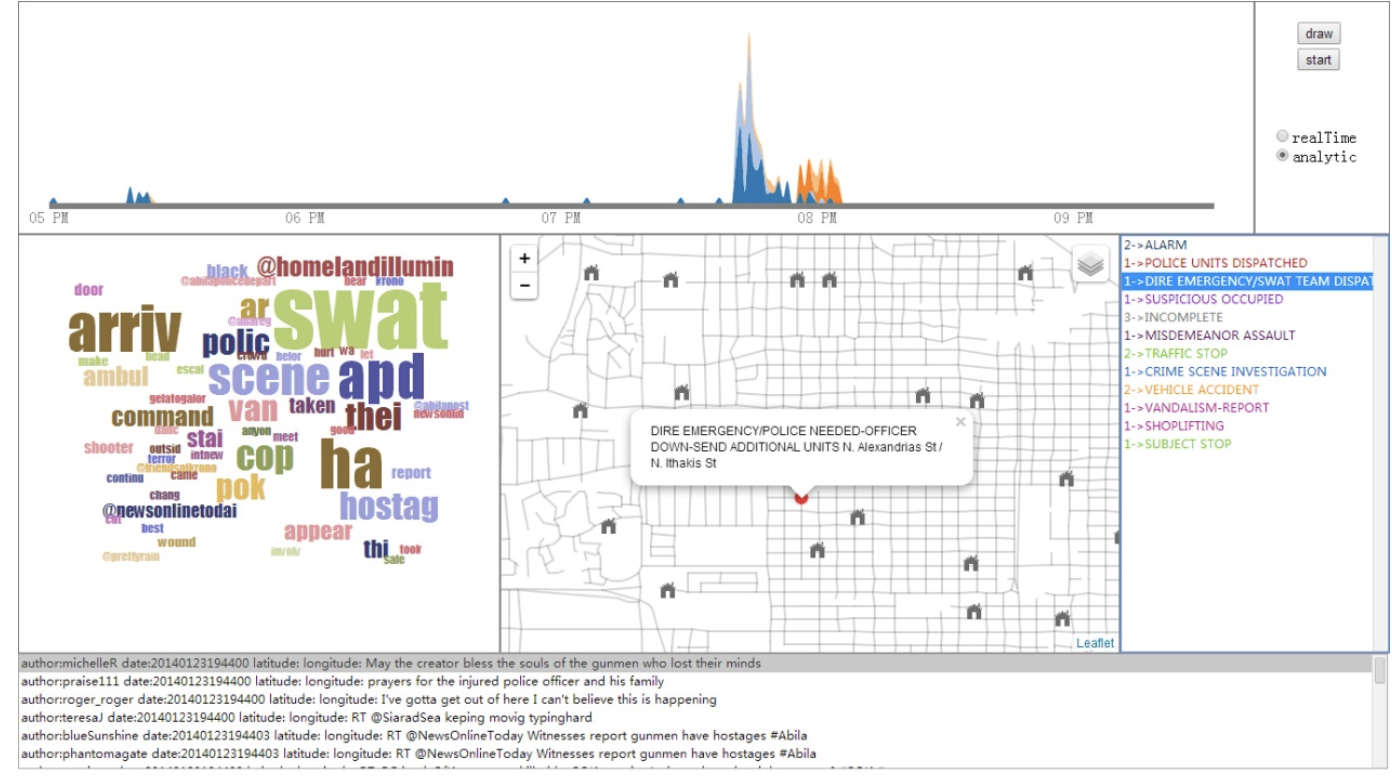
This blog will be focus on Vast Challenge 2021 Mini Challenge 3.
Text Visualization
A short description of the post.
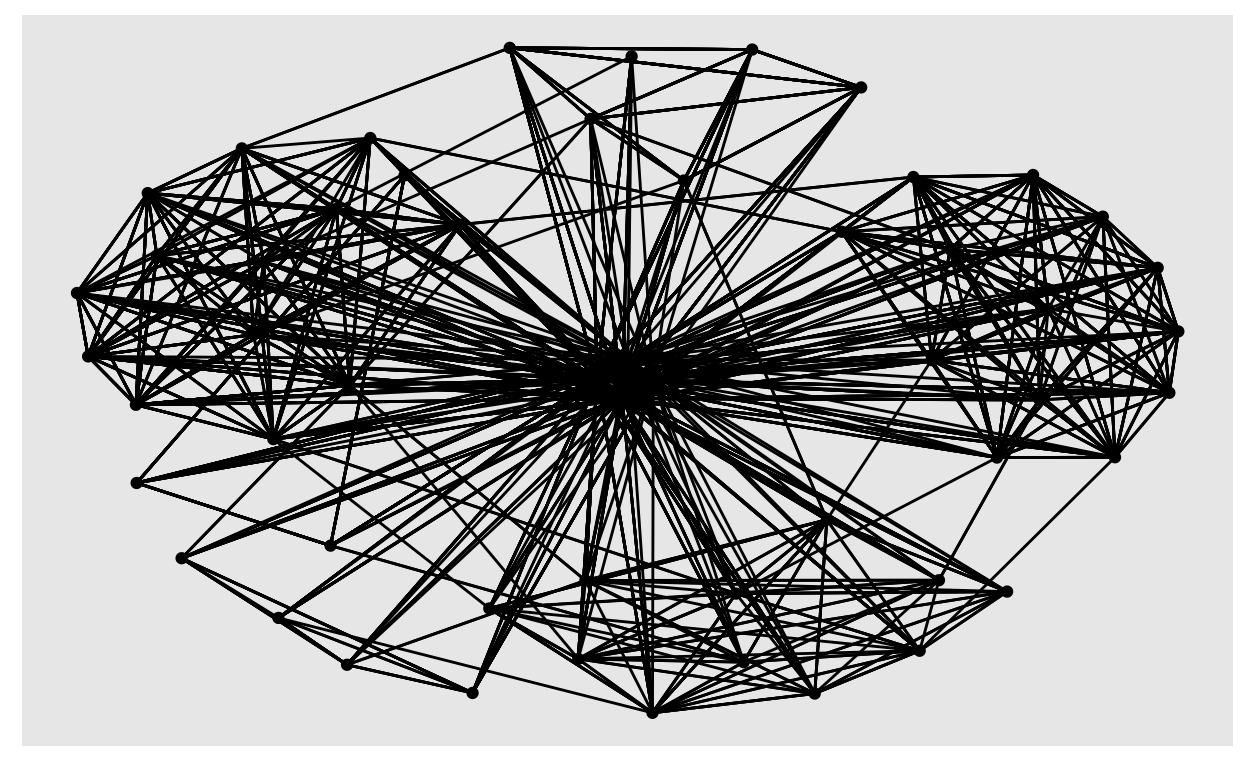
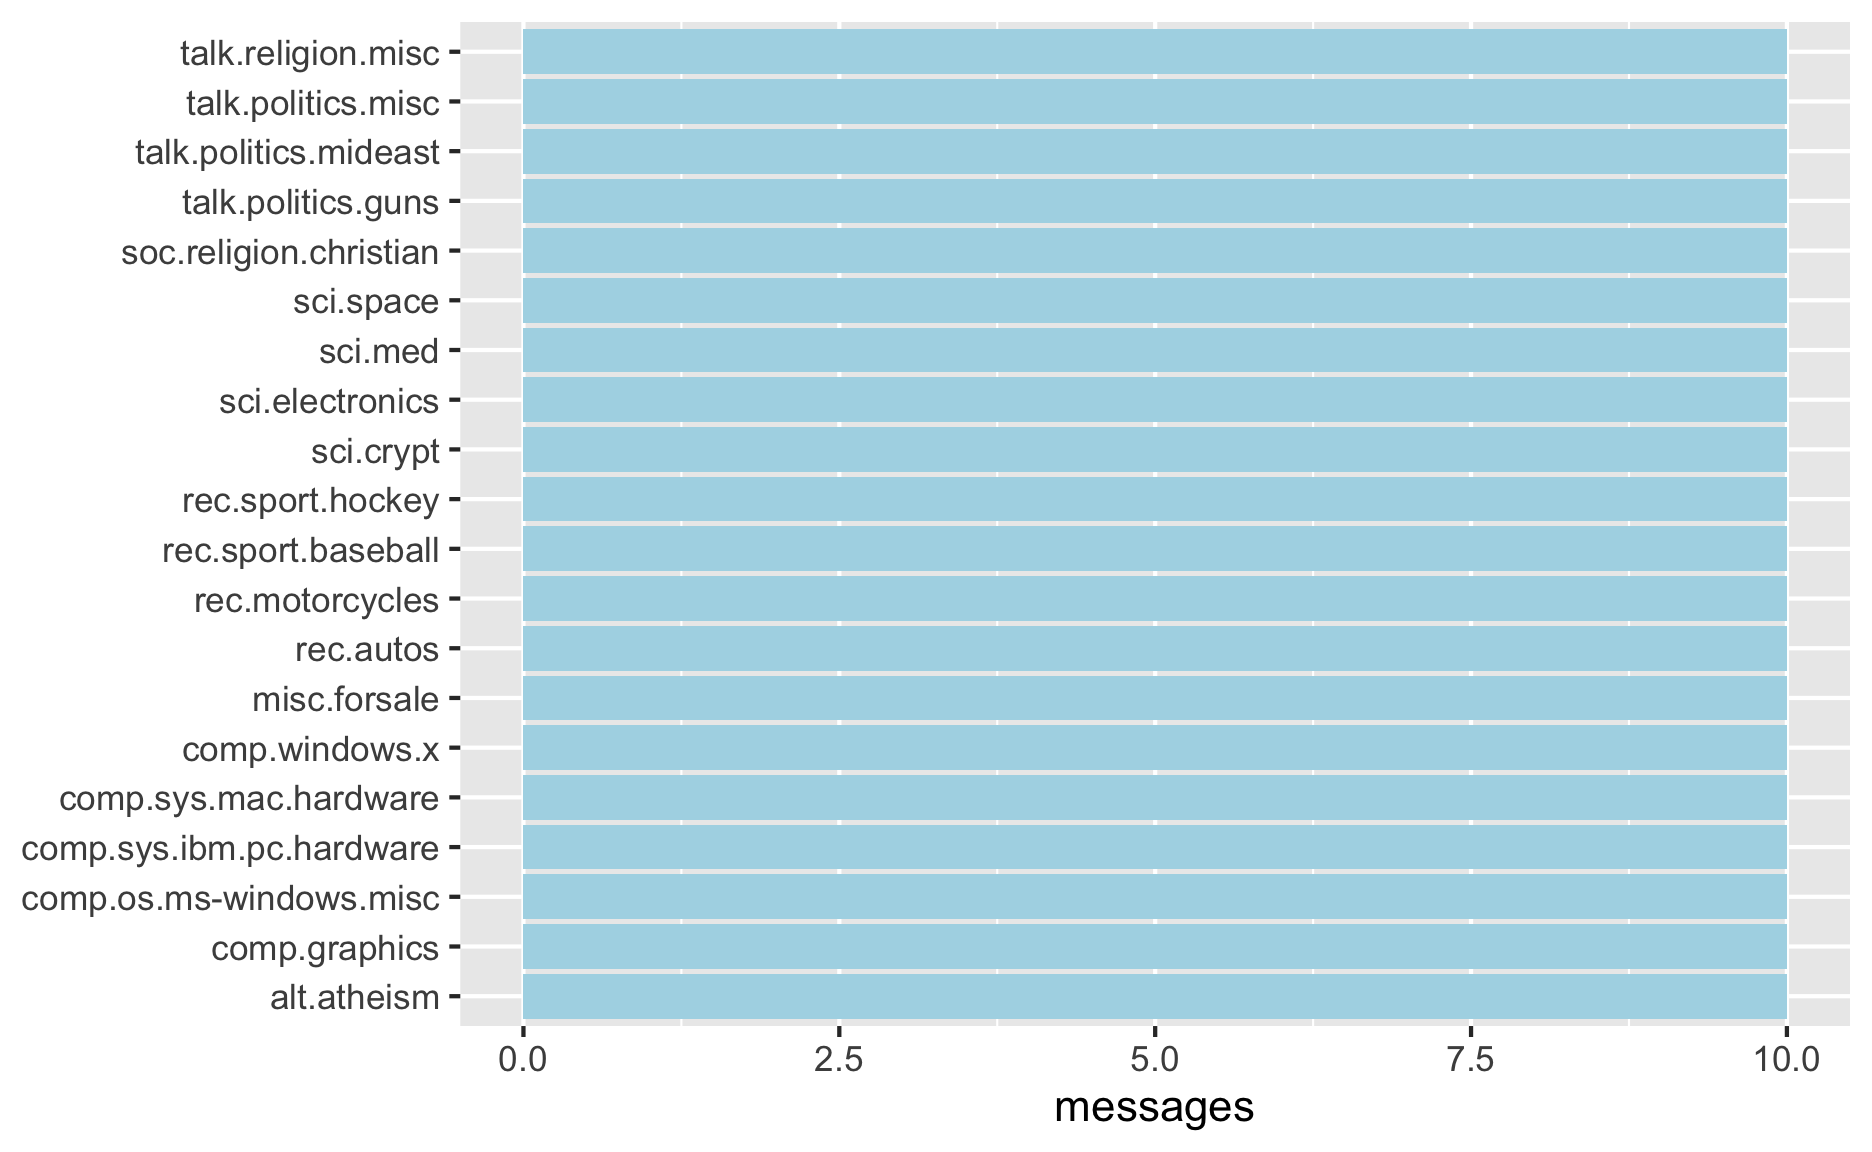
Network Data Visualisation and Analysis
We will explore ways to visualize network data using R in this post.
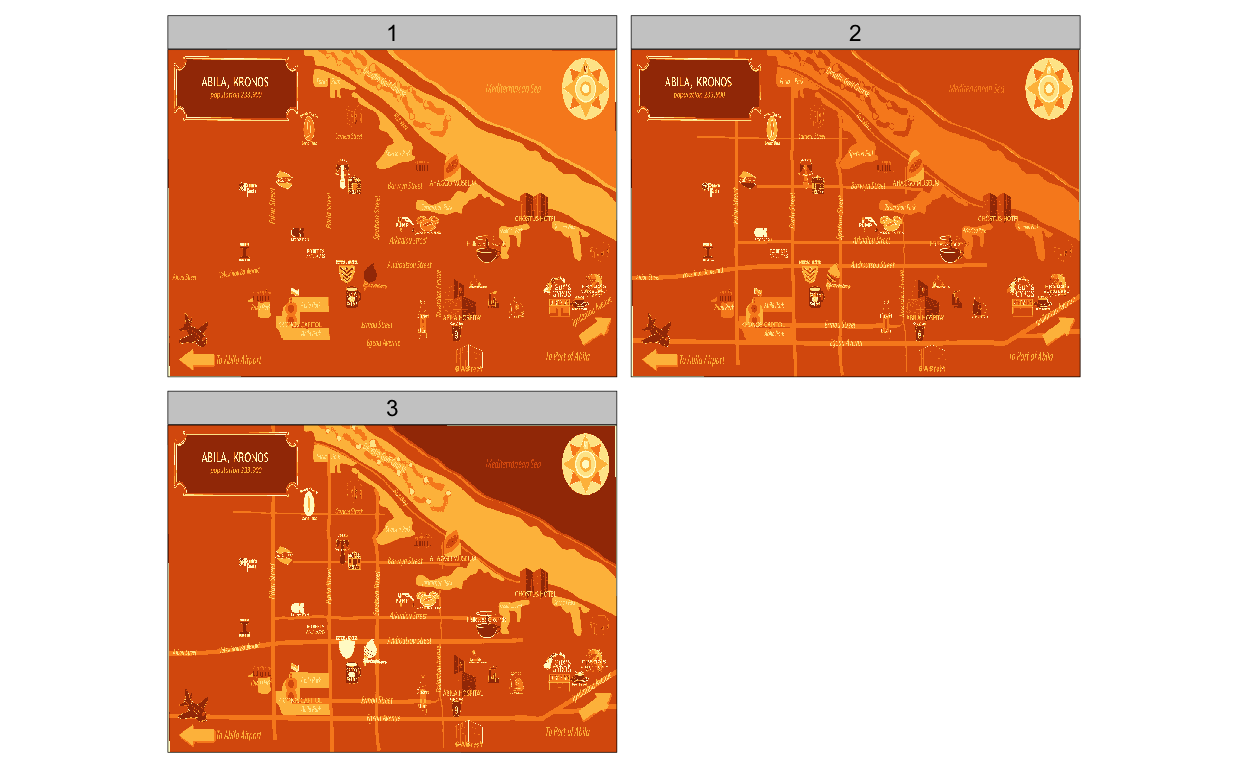
MovementVis with R
We will learn how to visualise movements by using appropriate R packages in this blog.
Programming Data Visualisation with R
R is a powerful tool for data science and visualization. Tidyverse which is an collection of R packages is higly useful and recommended. All packages share an underlying design philosophy, grammar, and data structures. We will explore data visualisation using tidyverse in this blog.
DataViz Makeover 2
In this post, we present a trade data use case applying the appropriate interactive visual analytics techniques using Tableau. We will critique the visualisation and propose an alternative to improve the quality of message delivered.
DataViz Makeover 1
DataViz Makeover 1 for ISSS608: Visual Analytics
Welcome to DataViz Blog
Welcome to my new blog, DataViz Blog. I hope you enjoy reading what I have to say!